Vehicle Architecture Synthesis
Please enjoy the 2-minute summary gallery below, or scroll further to explore my work in greater detail




Project Background
The vehicle architecture, in the context of this project, defines the platform around which the rest of the subsystem components are designed. This includes the overall vehicle dimensions, as well significant packaging and layout decisions. Since the architecture rests as the starting point for the rest of the vehicle design, it is critically important that it aligns with our overall design goals and ideology.
The vehicle architecture synthesis takes place as the first step in the overall project that was the 2020 vehicle design tradespace analysis. You can read more about that project here. In this page, I will walk you through the two optimization loops that were carried out to maximize a vehicle design concept, as well as the supplementary analyses to ensure secondary goals were met. Moving forward, this vehicle architecture will serve as the launching point for the Clemson Formula SAE team's newest development platform.
Starting Point Caveats
When generating a vehicle architecture tied to a driving design ideology, two of the most important variables are the tire and engine selection. This is especially true for Formula SAE, where there are several types of concepts allowed in the technical regulations. Correctly matching an engine, tire and vehicle concept is critical if you are approaching from a clean slate.
For our team however, it was practical to carry over our existing infrastructure and use that as a starting point. This includes using the Honda CBR600rr 4 cylinder engine. Our team has invested so much time and resources into this engine, including things such as spare parts, Ricardo WAVE models, and dyno stand components, that changing engines would be unjustified given our financial limitations. In addition, our knowledge of the design and tuning decisions that best suit the engine took years to develop, and it would be hard to properly evaluate other engines to the same degree.
The CBR600rr, for its many virtues, suffers from high weight compared to its alternatives. Combining this with our manufacturing capabilities (a carbon monocoque is still a few years out, for example) sets a rough floor estimate for a minimum achievable vehicle weight. This, in turn, affects our tire selection, and was a factor in the decision to use the Hoosier R25B (more information here).
In summary, it would have been ideal to start with a clean sheet for this project, but given the time and resource limitations of the team it was better to use the current engine+tire combination as a launch point.
Analysis Methodology
My vehicle architecture exploration took place within the previously mentioned tradespace analysis framework. Analysis was carried out inside ModeFRONTIER, creating a central environment to link the relevant subsytem models together. My quasi-steady state lap time simulation was used to evaluate design concepts, with the primary objective to maximize dynamic event points scored. The vehicle model used was a two-track bicycle model with aerodynamics, leaving out suspension kinematics and other higher order effects while accounting for weight+load transfer distribution. This took place over three phases. The first phase is the "Conceptual Optimization", where vehicle dimensions and mass properties were free, uncoupled variables. This allowed for an exploration of the isolated effects of the parameters in question, to start to inform potential design targets. The second phase was the "Parametric Optimization", where vehicle parameters and the subsequent mass distribution properties were coupled using the Solidworks parametric chassis model. This allowed me to constrain my optimization to feasible and realistic solutions. The final step is a supplementary analysis of vehicle response and stability metrics, to help inform a final decision.
Conceptual Optimization
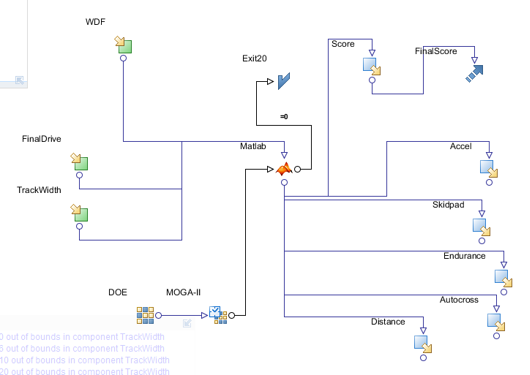
For the conceptual optimization, I explored the effects of weight distribution, track width, and final drive ratio on vehicle performance, using the single objective to maximize dynamic event scores. This is reflected in the ModeFRONTIER workflow below, illustrating the inputs (green), outputs (blue), and optimization objectives (blue arrow). All optimizations began with a pseudo-random Sobol sequence, with starting points equally distributed within the design space. Final optimization was carried out using a Moga-II genetic optimization routine.
Final Drive Ratio
First I'd like to discuss the gearing (final drive) exploration. Our team adjusts final drive ratio by changing the engine output sprocket. I included it in this analysis because of the potential to impact aerodynamic design targets and torque delivery as they relate to rear grip and straight line acceleration. Due to the intake restriction regulation in Formula SAE, however, our car was power limited for the majority of its operating range, even with a more powerful 4-cylinder engine. As a result, final drive results turned out much more straightforward.
The plot below outlines the final drive effects on the straight-line acceleration event alone. The shortest gearing configuration (blue, 11 tooth sprocket) is faster, so long as the rearward weight distribution is high enough. Otherwise, at around 58% front weight, the 12 tooth sprocket (green) overtakes it with more traction off of the line.

Acceleration event score (y) versus front weight distribution (x), color coded by the number of teeth on the engine sprocket.
However, once on the track, the results turn to favor the 12 tooth sprocket. The plot below summarizes configurations explored with all three sprockets, and the subsequent autocross and endurance event scores. The 11 tooth sprocket, despite the improved acceleration, increased the necessary amount of gearshifts around the course, hurting overall performance. This is supported by final drive testing results the previous year, where drivers preferred the 12 tooth sprocket for the same reason. They also disliked the 13 tooth sprocket (the tallest configuration available) for a lack of accessible torque at low speeds.

Endurance event score (y) versus autocross event score (x), color coded by the number of teeth on the engine sprocket.
Interestingly enough, when comparing the 11 and 13 tooth sprockets, the 11 tooth performs better on the endurance course, while the 13 tooth performs better on the autocross course. When comparing the course maps, the autocross course is far more flow-y and slalom-heavy, while the endurance course features more significant acceleration and braking zones. These areas are where the car benefits more from an added acceleration boost, which helps explain the performance split.
Weight Distribution
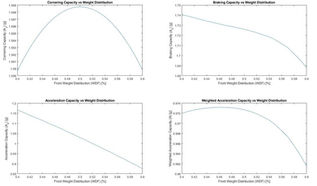
Next I will discuss the results pertaining to weight distribution. Whenever possible, I like to preface my optimization routine with an independent design exploration, to make sure the expected vehicle behaviors are being captured. This also helps build an intuition framework from which to view future optimizations. The following plot explores the effect of weight distribution on individual acceleration mode performance:

These results line up with the intuition that a 50/50 weight distribution favors cornering performance, loading the front and rear tires equally, and that a rearward weight distribution favors acceleration and braking performance. As speed increases, these benefits in longitudinal acceleration become less pronounced due to less torque on the rear axle and downforce having a more dominant effect on tire loading.
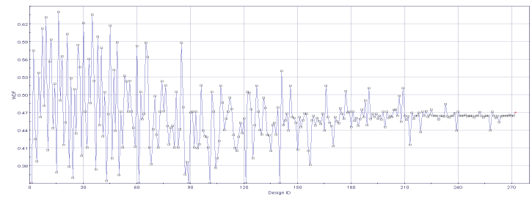
Intuition would suggest the optimal weight distribution depends on the relative importance of cornering and acceleration capacity, and finding the right balance between the two. Below, you can see the iteration trace of the ModeFRONTIER optimizer converging to a final weight distribution of around 46.5% front, bringing the best combined scores from the skidpad, acceleration, autocross, and endurance event.
Based on the final drive differences between autocross and endurance, one would expect a similar difference in optimal weight distribution in the two events. And sure enough, the acceleration and braking-heavy endurance course favored a higher rear weight distribution (55%) than in autocross (53%). The overall summary plot lies below. The relationship lies very similar to the weighted graph in the original design exploration, but it is interesting to note that the score differential for a range of +/- 5% is quite small. This is likely due to the superior load sensitivity of the R25B compound which I have discussed earlier, which makes the load transfer effects on combined acceleration less drastic.

Total points scored (y) versus front weight distribution (x), color coded by track width
Track Width
The final parameter left to explore is the track width. My initial guess was that a larger track width would benefit the cornering performance of the vehicle by reducing the amount of total load transfer to the outside wheels, with little trade-off anywhere else. The track width effects on isolated cornering are displayed below:

However, the optimizer ended up converging to the smallest possible track width. Upon further inspection, I found that the track width had a significant effect on the trajectory of the vehicle taken on the different tracks. Since FSAE courses are incredibly tight, the ability to take a narrower path through hairpins and slaloms can cut down lap time significantly, far outweighing the effects of reduced cornering capacity. This is best displayed in the graph below:

Distance traveled in the endurance event (y) vs track width (x), colored by endurance score
This demonstrates that a car with a lower track width needs to cover less distance in order to complete the endurance course, and does so in a shorter time despite the lateral acceleration penalty. To re-frame this in another perspective, a 5% reduction in track width correlated to an average 10% increase in the average path radius across the endurance track. Ultimately, the track width floor is limited not by a performance drop off, but the practical requirement to leave space for the driver, frame and cooling system within the tire bounding box.
Parametric Optimization
The parametric optimization takes things one step further by incorporating the chassis parametric model to couple the effects of packaging and mass distribution. This also introduced new inputs, including wheelbase and driver position, as well as new outputs including principal X Y and Z inertia, CoG height and aero bounding box dimensions (to reflect more downforce potential). In addition, a secondary optimization objective was included, which was to reduce the settling time for a step-input cornering maneuver at 30 ft/s (average skidpad speed). Final drive ratio, track width, and weight distribution results came out quite similar to the previous conceptual optimization, so I will not discuss them again. Now under consideration, however, is the packaging decisions to be made to achieve that target weight distribution.
Driver Positioning
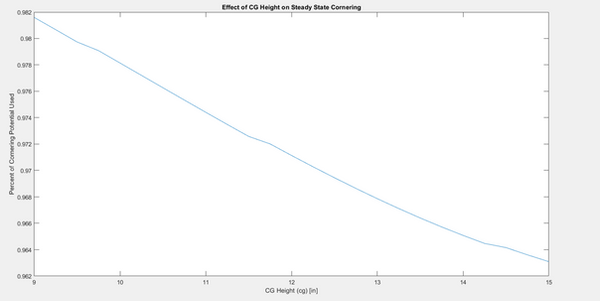
In order to achieve a target weight distribution, the driver and the engine were used as balancing points around the cg. Another variable at play, however, was the spacing between the driver an engine. Packaging them closer together would reduce the yaw intertia of the vehicle, but would also require the driver seating position to be more upright. This in turn would raise the center of gravity, as well as block more airflow to the rear wing, hurting both aero and suspension performance. The center of gravity effect is demonstrated below:
Since tire load sensitivity is an unavoidable tire characteristic, limiting the total amount of load transfer to the outside wheels is always preferred to maximize cornering performance. However, the inertia effect is equally significant. The trade-off between the two is easily seen below:
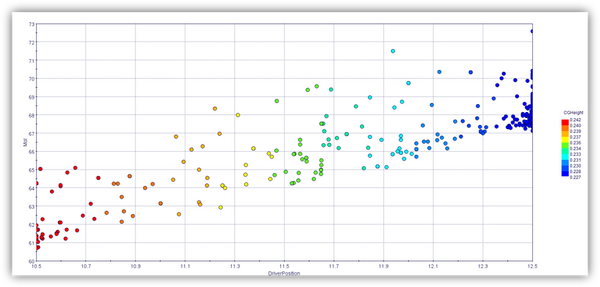
Yaw inertia (y) versus driver+engine spacing (x), colored by cg height
Ultimately, the optimizer converged to a point near the lower end of the threshold, placing the engine and driver closer together. This solution favors minimizing yaw inertia over cg height.

Apologies for the poor image quality. I can't figure out why the iteration plots specifically are coming out so poorly.
Before I take these optimization results blindly, it's important to interrogate the solver, and understand why it convereged to the given solution. Taking pure cg height effects in isolation, the effect of raising the cg by a small amount does not have a significant effect on the steady state vehicle performance. In a separate sensitivity analysis, it was found that a 1" difference in cg height accounted for roughly a 2 point (or 0.5%) difference in total event points. This is again due to the low load sensitivity of the R25B compound, and it is important to note that at much higher cg heights, this effect becomes more exacerbated.
One factor that was not accounted for, however, is the transient effect of increasing the cg height, which in turn raises the roll and pitch inertia of the vehicle. In a model that captured this effect, this would hurt overall vehicle response, and require stiffer roll rates. This will be important to keep in mind moving forwards.
On the contrary, driver and engine spacing had a much larger effect on the yaw inertia of the vehicle, which was captured in the response analysis. Moving the driver an engine one inch closer together decreased the yaw inertia by over three percent, which improved settling time by around the same amount (~3.5%). Because of this, the response benefit from the yaw inertia reduction outweighs the cg penalty, explaining the convergence point of the optimizer.
Wheelbase
The wheelbase is very coupled to the engine and driver positioning in determining the overall inertia of the vehicle. Another two factors accounted for were the change in total vehicle weight and undertray area (and by extension, downforce produced by the floor). To simplify the analysis, these two outputs were assumed to vary linearly with wheelbase.
Shrinking the wheelbase reduces the yaw frequency and damping of the vehicle, as well as the total downforce production potential, while the weight effects are not very significant. Even though the total yaw inertia also decreases, this does not result in a faster response time, as can be seen in the plot below. This is because the yaw frequency and damping effects are more significant than the inertia effects.

Despite these considerations, the optimizer immediately converged to the smallest wheelbase possible. After further examination, I discovered that this was again due to vehicle trajectory effects. A smaller wheelbase boosts the "effective steering ratio" of the vehicle, and creates a smaller footprint with which to navigate the track. This meant that, similar to the track width, a smaller wheelbase created a more maneuverable vehicle.
Supplementary Analyses
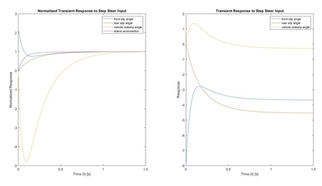
After both optimizations were complete, I carried out two supplementary simulation analyses to evaluate the responsiveness and stability of the vehicle. The first was to repeat the transient step steer simulations, but with more detailed information outputs in order to gain insight in the optimization results. I also added a roll degree of freedom to capture the effect of roll inertia. Simulations were solved using ODE45 in Matlab, and an example output plot is shown below:

This allowed me to create sensitivity plots like the one below, and compare the results to see if they line up with what the optimizer did:

In addition, I used a simplified, linear 2 degree of freedom bicycle model to explore the effects of these parameters on key vehicle stability metrics. These include the path curvature factor, stability index, and tangent speed. Since stability was not a factor in the original optimization, it was critical to carry out this analysis to ensure that any final vehicle concept would maintain adequate control and drive-ability. I used these results to create more sensitivity plots to further guide my decision making:
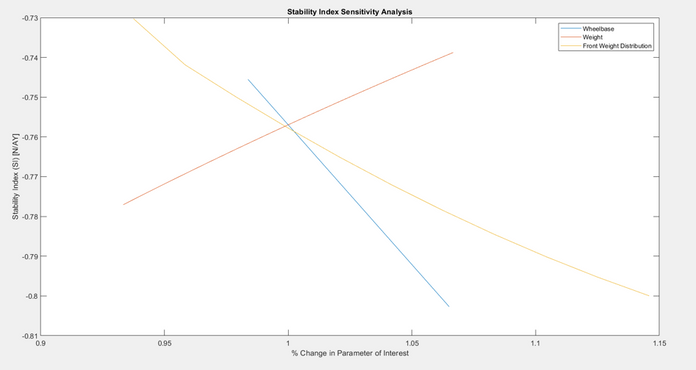
The combined insights from these studies are summarized in the table below:

Final Selection
My final decision was based on results from all three analyses. For the track width, I decided to go as small as was allowed by our packaging requirements, to minimize the path curvature of the vehicle on the autocross course. I chose to keep a small wheelbase for similar reasons. Between the improved steering ratio, smaller footprint, and decreased tangent velocity, the vehicle would become more maneuverable, which is absolutely critical on tight and twisty FSAE circuits. There is a distinct trade-off of course, in the stability and response time. However, I determined that for the vast majority of cornering situations, the vehicle was overdamped in yaw, and therefore a decrease in yaw damping would be less troublesome. In addition, the top speed of FSAE circuits was slow enough that the stability index (which is hurt by a short wheelbase) did not vary to a significant degree.
For the weight distribution, I decided on a target of 50% front/rear. Even though the optimal steady state performance favored a slightly rearward weight distribution, the points margin was ultimately small (~0.5%). Meanwhile, a rearward weight bias would require significant sacrifices to the suspension design in order to achieve similar response times and vehicle balance. Therefore, I decided to favor drive-ability at the expense of pure steady state optimization. The final driver placement matches the original optimization results, favoring yaw inertia over center of gravity height. This is enabled due to the low load sensitivity of the R25B tire compound. In addition, at this stage in the design process, exploration of a decoupled-mode suspension had reached considerable maturity. Independent roll control could be used to account for the increased roll inertia without having to sacrifice ride quality, reducing the sacrifice in roll response. Lastly, the final drive ratio is set to the 12-tooth sprocket, as that gearing suits the power curve and track characteristics best.

Future Development
In the future, I would love to develop the complexity of the multi-objective optimization, incorporating performance, response and stability into a single optimization loop. This would improve the efficiency of the whole design process, as well as allow me to better explore the design front and objective trade-offs.
In addition, I think there is more detail of exploration that could take place in the interactions between weight distribution, understeer gradient, steering ratio and response time. For this iteration, understeer gradient was held fixed at a target value. However, understeer has a significant effect on response time, and the steering ratio can be adjusted to decouple the response and understeer as experienced by the driver. This in turn introduces the trade-off of the steering power requirements at the wheel.
Finally, my recent studies into differential tuning have given me a new appreciation for the effects of the differential on both performance and drive-ability in combined acceleration scenarios. I now recognize that the differential and weight distribution can be coupled, and must match together to suit a given design ideology. Overall, however, I am very happy with the first iteration of this project, as it creates a strong foundation for the team to continue future development along a well defined design direction.